Adding Multiple Content Types to Your SharePoint Library

Normally when you create a new document library, you get to choose from a list of available document templates that will become the default document type when the user clicks the New Document option in the Document ribbon.  While you can set the document type in the Advanced Settings of the Library Settings option group, you can only select one document type as shown in the following image.


In this case a Microsoft Word document was selected as the default content type for new documents.  This does not mean that the user is limited to only storing Microsoft Word documents in this library.  In fact, they can store Microsoft Excel documents, MS Project files, MS Publisher files and even MS PowerPoint presentations files.  The image to the right shows the range of possible default content types you can assign to the library when creating it.

 Of course you can also save generic text files, PDF files and just about any other type of file in the library as long as the file is uploaded to the library rather than created from within the library.  That means a lot of extra steps that many users may not be comfortable with.  For example, to create an Excel spreadsheet file, they would first have to open Excel on their local desktop or laptop computer and create a new Excel file.  Then to save the file in the SharePoint library, they might first save the file locally before going into the desired SharePoint library and uploading the document to the library.  Some users might even know that they can save directly to SharePoint from the Excel Save dialog by first entering the URL for the site in the File Name text box, clicking Open, and then selecting the library where they want to save the file.  In either case, both options require a few additional steps compared to the ability to directly create a Word document in the library. 

So you might ask whether there is a way to have more than one content type available from the New Document dropdown which initially only shows the type: New Document which is actually a MS Word document?

The quick answer is Yes.  However, it may require a few steps that you may not intuitively figure out.  So let’s go through the steps of adding an Excel Spreadsheet content types to a sample document library.

First you must you must create the blank Excel template file.  To do this, open Excel but do not type anything in the spreadsheet.  (Of course if you wanted to create a predefined Excel form for people to fill in, you could create the entire Excel spreadsheet and lock all the cells except for the cells where you want users to enter data.)  Then open the File menu and select Save As.  In the Save As Type dropdown, select Excel Template as the file type rather than just Excel.  Give the template a name such as: Excel Template and save it to a location where you can find it later.

Next, return to SharePoint and navigate to the site where you want to create the library, and if the library does not already exist, create a new library.  You can leave the Microsoft Word document as the default content type.  After creating the library, select Site Settings from the Site Actions dropdown.

 On the Site Settings page, SharePoint groups the available options under different headers.  Find the header: Galleries.  Within this header, click on the option: Site content types as shown below. 

The page that appears shows all of the content types currently defined.  You can scan through the list to see if anyone else may have created a content type for the other Microsoft Office applications, but chances are they have not.  Therefore, you can click on the Create link at the top of the page to begin the definition of a new content type.

 The dialog that appears next asks for some general information about the template including the template name and description.  Remember that SharePoint shows this information to the user when they select the New Document dropdown so you want to make this information brief but informative.  For the purpose of this example, I will simply use Excel Template for both.

Next you need to select a parent content type.  In this case, choosing Document from the Document Content Types group is the most similar content type from the available list.  This selection defines some of the metadata that SharePoint automatically makes available to the new content type.  In this case, the only visible metadata column (by default) is the Title column for the document.  For most Microsoft Office documents, this selection will suit our default needs.  You can go back after creating the content type and add more metadata columns to the content type.

You also have to assign the new content type to a content type group primarily to make it easier for users to find it.  Because this example is all about creating additional Microsoft Office content types, I will opt to create a new group named Microsoft Office documents.

After clicking OK, you will see another settings page similar to the settings page for the library.  However, this is the settings page for the content type.  Under the Settings group, click on Advanced Settings.  Just as with libraries, the dialog from this option has a property that you can set to define the template used by this content type.

 Just as with libraries, the dialog from this option has a property that you can set to define the template used by this content type.  Click the radio (option) button to Upload a new document template.  You can directly enter the path for the template from your local computer or you can click the Browse button.  I prefer using the Browse button just to be sure that I do not spell anything part of the document path incorrectly.  You can choose to lock the content type so that it is read only for most users.  You can also determine whether you want the uploaded content type to automatically update any site or list content types that may use this content type.  When first creating a new content type, this setting does not really matter.  However, if you later go back to edit an existing template with a new version it determines whether existing documents that use the template are also updated with the new template.  If you have several libraries that use this content type or the libraries have many documents instantiated with the template, this could take some time.  Therefore, try to get the template as close to being final as possible before loading it into a content type in SharePoint.


When you click OK, you now have a new content type that can be used anywhere on the current or child site in any library.  However, before you can use it, you must do one more thing to the library.

Navigate to the library where you want to use the new content type and select Library Settings from the Library ribbon.  In the resulting settings page, choose Yes to Allow management of content types in the Content Types group of options.


Then when you return to the general library settings page, you will see a new section named Content Types above the section that defines the columns used in the library.  Click the link Add from existing site content types just below the content types list.


In the resulting dialog, select the Microsoft Office Documents group in the first dropdown.  Remember I said that this would be a way to group your new content types.  As the figure below shows, this group currently only contains one content type, Excel Template.  Select it and click the Add button to add this content type to the current libraries available content types. Then click OK.


Returning to the Library Settings page, you now see two items in the Content Types.  The default Document content type and the new Excel Template content type.  The Microsoft Word document type is the default content type.  However, you can change this to the Excel Template if you want to by selecting the link: Change new button order and default content type.  For this example, I’ll leave the Microsoft Word document as the default content type. 

Now when you return to the library list itself and select the lower portion of the New Document button from the Documents ribbon, you see two entries.  The first entry is the original Word Document and the second is the Excel Template.  (Notice the use of the name and description used match what we defined for these fields when we created the content type definition.)

But you don’t need to stop there.  You can create template files for most of the applications in Microsoft Office that are document based such as Publisher, PowerPoint, and Project and going through the same steps as above, create content types for each of them.  When creating your templates, you might consider applying a standard style used by your organization to the template so that all user documents will automatically inherit that style.

Now when the user opens this library, they can directly create any of these content types opening the appropriate Microsoft Office application to begin editing from the template.

You can even create blank forms in Microsoft Word and Excel that when published allow the user to open a new document and just begin filling in the form before saving it back to the library as a regular document with their data in it.

Friends Don’t Let Friends Walk Drunk

In a recent episode of Freakonomics Radio (www.freakonomics.com), which by the way can now be heard every other week on NPR, Stephen Dubner and Steve Levitt bring forth statistics that show mile-for-mile you are 8 times more likely to get killed walking home drunk than from driving drunk.  Of course they are not proposing that you should go out, get drunk and then drive home instead of walking.  While some of these walking-involved injuries result from walking in front of a moving vehicle, many are also due to falling down steps or other similar accidents that involve no one else other than the individual themself.  They report that of the 34,000 people who died in traffic accidents in 2009, 41% of them were drunk.  Furthermore, in that same year, 35% of the 4,000 pedestrians who were killed were also drunk.  While that may sound like your chances as a pedestrian are slightly better, when you add in the number of miles travelled by those killed, it was far more dangerous to walk drunk.  In fact, January 1st has been shown to be the deadliest day for pedestrians with over 50% of the fatalities occurring to those who were drunk. Check-out the full podcast at Freakonomics-Marketplace.

So what is the solution if you cannot drive or walk home?  I suspect the simple answer to drunk walking remains the same as for drunk drivers.  This New Year’s Eve (and any other time during the year), make sure that someone in your group is the designated driver.  Then let someone else take you home if you do over indulge because I have lots of interesting things to talk about in the coming year and you don’t want to miss any of it.  Also I highly recommend listening to Freakonomics as a New Years resolution for anyone interested in a slightly different but statistical view on everyday things in life.

Be safe!

The Christmas Spirit and Making A Difference

Another Christmas has come and gone.  As the year 2011 draws to a close and hectic days of preparing for the holidays begins to wind down, it is a good time to review where you have been for the last year.  What did you accomplish or perhaps more to the point, did you make a difference?  Making a difference does not necessarily mean making a difference at work although there is nothing wrong with that.  But perhaps you made a difference in someone else’s life, a family member, a neighbor, or even a complete stranger.  Did you perhaps volunteer your time and talents for a local charity or non-profit?  Did you mentor someone?    Is there anyone that is better off today because you have been there?

If you answered any of the above with at least one accomplishment, then you made a difference.  But even if you cannot think of anything, you might be surprised to learn that you did touch someone else’s life in some way that perhaps you will never know.  In any case, the new year is the traditional time when we make resolutions for the coming year.  Sure you can make resolutions to lose weight, stop smoking, or perhaps exercise more.  Those are all good things.  But they are often forgotten after a few days.  Instead, try to think of at least one way that you can make a difference for someone else this year.  Perhaps you can learn a new skill and then teach it to your co-workers making all of you more effective at work.  Perhaps you can spend more time with your family, especially if you have kids, before they are grown and move away.  Maybe you can form a support group for your neighborhood to help others who may be going through some tough economic times.

You don’t need to public announce either what you did this past year or what you may plan to do next year.  In a way that is just bragging, looking for others to praise you.  Ultimately that detracts from the sense of accomplishment that just doing something will give you.  So rather than read a long blog today, take a few moments and think about where you might channel your efforts this coming year.  Then don’t tell anyone what it is.  Just go out and do it.

Remember what Ian Anderson of Jethro Tull said, ‘The Christmas Spirit is not what you drink.’

See you all next year.

Merry Christmas!

I would like to wish all of my readers a very Merry Christmas, Happy Hanukkah, or just simply Happy Holidays.  Thank you for becoming a reader to my posts.  Your continued interest makes all the effort worthwhile.  In the new year I hope to continue to cover topics of interest to you beginning with some new posts on DAX and building Analysis Services databases.  I’ll even get around to covering SQL 2012.

Being in Florida it is very warm, warmer than usual actually for this time of year.  The temperature is around 80 degrees Fahrenheit.  Since I grew up in Pennsylvania, the one thing I do miss is snow at Christmas, the quiet that only a snow-covered countryside can produce, and the bright stars in the cold crisp evening air.  Oh well, maybe next year.

See you then.

Be a Solver of Complex Problems

Last week I showed how you can use Goal Seek to solve for a single unknown input value that will result in a specific value.  Goal Seek works well and is fast at solving for a single input value.  However, not all real world problems are so simple.  In fact many problems involve the manipulation of several input values under defined constraints to yield a minimum, maximum or exact value.  Want an example?  I thought you might.

Suppose you were part of a management team responsible for selecting which of 10 possible IT projects to move forward into next year’s portfolio.  All of the projects on the surface sound good because they all have a positive Net Present Value (NPV) calculated using methods similar to last week.  Each project requires resources that might include labor and investment dollars.  The problem is you only have $150,000 to invest in projects and your staff has been cut to 42 people.  In your staff you have two managers, five DBAs and 35 developers.  From the project managers, you got a list by project of the number of hours needed from each staff type.  Now your challenge is to select which combinations of projects you should commit to for next year to maximize the revenue that these projects will bring to your organization.

To start, let’s build an Excel spreadsheet that displays the known data.  In the figure below, you see the list of 10 projects in the first column.  I have cleverly renamed these projects Project A through Project J to disguise their real names.

Column B (the second column) holds a flag to identify whether the project is included in next year’s portfolio of projects.  I’ll initially set all of the flags to ‘1’ or selected.  You’ll see in a moment that this is not a practical solution because it exceeds the available resources

Column C (the third column) shows the Net Present Value of each project.  Then column D (the fourth column) shows that Net Present Value of only the selected projects.  Of course initially, this column looks like column C because all projects start off selected.  However, when a project is not selected, the value in column B for that project changes to 0 and 0 multiplied by the project’s NPV will always be 0.

Cell D17 sums the net present values for each of the selected projects.  Thus you see that if you selected all ten projects,  you would have a net present value of $2,440,000.   Knowing that you do not have the resources for all ten projects, your net present value will be less than this.  However, you do want to maximize this value.

In columns E, F, and G (columns 2-4 in the figure below) you see the number of hours each project would need from each of the labor types.  Beneath the project hours are three rows that calculate the number of available hours for each labor type.  If you assume that there are 2000 work hours in a year, then with two managers you have 4000 hours available.  Similarly, 35 developers can provide 70,000 hours of developer time and 5 DBAs will contribute 10,000 hours of DBA support.

Now in the next figure, you see what happens when you multiply the number of hours for each staff type that the project needs by the selection flag (remember it is 0 or 1 only.  No fractional projects are possible.)  In row 16, you sum the number of hours the selected projects needs.  When you compare the number of hours needed by staff type to the actual number of hours available in E18..G18 you see that you don’t have enough hours within any of the staff types to do all of the projects.  Therefore, you know right that the simple solution of doing everything is not an option.

Furthermore, let us also suppose that some projects require some up-front investment dollars.  Unfortunately, you only have $150,000 available (See cell D16).  The required investment for each project is shown in column H in the following figure.  Some projects have no investment and thus you see $0 in those cells.  Then you can multiple the values in column H with the selected flag from column B to get the actual investment needed by the portfolio of projects shown in column J.  Summing these values into cell J18 you see that if you committed to all the projects, you would need $218,000, but you don’t have that much money.

So far, I have identified the following constraints:

  1. Projects either go or they do not go (1 or 0).
  2. The total number of available hours by each staff type cannot be exceeded.
  3. The total investment amount needed cannot exceed $150,000.

So now it is time to decide which projects to include in your active portfolio for next year.

What’s that you said?  You’ll just try different random combinations of projects to see what their total Net Present Value is?  Well, you could do that.  However, it would take you awhile to try every possible combination.  Your next thought is that there has to be a better way to solve this problem.

There is and that better way is called the Solver.  The Solver uses techniques based on linear programming to define a multidimensional volume of valid solutions.  It defines this volume based on constraints such as the ones mentioned above.  Then you have to set a goal for the solver such as to minimize or maximize a specific calculated value that is defined by the points within the volume.

Still don’t know where to begin.  Where is this Solver?  If Solver has not already been added to your version of Excel, you can download it from:

Windows Excel 2010: http://www.addictivetips.com/windows-tips/microsoft-office-excel-2010-solver-add-in/

Mac Excel 2011: http://www.solver.com/mac/dwnmac2011solver.htm

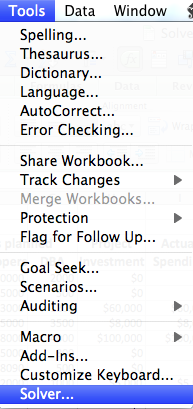
Both tools work essentially the same and the above referenced pages provide instructions on how to install these tools.  Since I am creating this example on a MacBook, this add-in appears in the Tools dropdown as shown below:

When opened, the solver displays a dialog similar to the one shown below:

Next you must define how the Solver should go about solving your problem.  First, you need to define the object cell.  In this case, you want to maximize the net present value of our selected project portfolio.  I previously mentioned that I calculated this value in cell D17.  After entering the objective cell, be sure to click the maximize button.  Notice that you can also choose to minimize your objective (such as when looking at costs) or converge on a specific value.

Next you must tell Solver which cells it can change.  In our case, these cells are the project selection flags found in column B5:B14.

Every problem has constraints.  In the next section you must define the constraints you know the system must obey.  For example, you know that the values in B5:B14 must be either 0 or 1.  You can do this with the following three constraints:

$B$5:$B$14 >= 0
$B$5:$B$14 <= 1
B$5:$B$14 = Integer

Note that these three constraints taken together insure that each project flag is 0 or 1 and is not a faction.

Next look at the number of remaining hours for each of the staff types.  Remember I said that you can not use more hours in your project portfolio than you have staff hours for each staff type.  Another way of saying the same thing is that the remaining hours cannot be negative.  If the remaining hours are positive, that means that the staff is not fully utilized by the selected projects.  However, if any one of the three staff types fall to zero, no other projects can be started that require that staff type.

$K$18:$M$18 >= 0

Finally, you have to make sure that the initial investment (I18) does not exceed the amount of money in the budget for next year (D16) using the following constraint:

$i$18 <= $D$16

Then check the box that limits unconstrained variables to positive values unless you know and want certain constraints to be negative.

There are three methods you can use to solve the problem.  Each method should come up with the same solution (Although I have seen in very complex constraints minor variations between the solutions.).  Some methods let you see each iteration flash by as the algorithm narrows in on a solution.   Simplex LP (Linear Programming) does not show iterations.

After selecting a method to solve your problem, click the Solve button.  Within a few seconds, Excel solves this simple problem by showing the following project portfolio selection to yield a maximum net present value:

This Solver tells you to include projects D, E, G, H, and J in your next year portfolio for a maximum net present value of $1,520,000.  Looking at some of the other data, you will see that these projects used $113,000 of the available $150,000 as startup capital.  While some manager and developer time remains unused, the selected projects will use all of the available DBA hours leaving nothing for any other projects.

While this example was simplified to help illustrate the method, you can use the Excel Solver with more complex problems and more constraints.  For example, the above analysis assumes that all developer hours are equal and that you can use whichever developer is available for each hour of the project.  This simple analysis is not realistic, but it does serve to show the power of the example.  To improve the accuracy of the model, you could develop a spreadsheet that includes each individual staff member as a separate constraint.  This change complicates the problem shown here substantially.  Also the current example does not consider the timing of the activity of each employee type.  Obviously, if the two managers were needed heavily at the start of each of the selected projects, the number of projects selected could be different.  It also does not consider if the project is front-loaded with staff or back-loaded with staff.  Front-loaded projects use most of the hours in the first two weeks or months.  Back-loaded projects tend to use most of the staff hours toward the end of the project rather than the beginning.

While all of these concerns are true, the Excel Solver still provides a good first solution to a problem that requires you to maximize or minimize a goal limited by constraints that make it difficult, if not impossible to easily manually calculate the solution.

On this Christmas eve, let the spirit of Christmas fill your hearts no matter what religion beliefs you may have.

The Definition of Futility

Someone once said that the definition of futility is doing the same thing over and over and expecting different results.  Okay, I know there are exceptions like going to Vegas and putting a coin in a slot, pulling the arm by the side of the machine (or is it pushing a button now) and expecting that maybe this time all the wheels will align and you will win a small fortune.  Of course, most of the time you lose or at best only win back a portion of what you already committed.  But other than games of chance or where random factors come into play to determine the outcome, doing the same thing over and over usually results in the same conclusion.

What’s my point? Many people think that just by implementing SharePoint to serve as their document repository for their company or department that somehow SharePoint will solve their problems with organizing and finding their documents.  You see they already spent years creating a complex hierarchy of folders within folders to store their documents in shared network drives.  They learned this paradigm well over the last several decades.  The problem is that while their hierarchy may make sense to them, at least at the time they created it, it does not make sense to other users who have to hunt through the labyrinth of folders to find a file today.  Often they too lose track of where files are store as well and end up storing the same file in several places.  The problem then is not only that the original file is lost, but that there are multiple copies of the file, each with its own set of revisions.  Now when someone needs to open a copy of the file to add something new, which one is right meaning which one has all of the revisions, if any?

Then someone brings SharePoint into the organization and promises that it will solve all their document storage concerns.  Great sighs of relief are heard throughout the halls of the organization for a solution is finally at hand.  However, no real paradigm change occurs.  The users immediately begin to recreate the same folder within folder nested mess they had in their network file share because that is all they know; only this time they create it within a SharePoint library.  Soon the complex storage structure begins to experience the same navigation and management issues the file share had and throughout the halls of the organization are heard mumblings of discontent and mutiny that SharePoint solved nothing.  They still cannot find anything they need.

First, before you start to tell me that all these poor souls need to do is to use Search, I need to point out one or two small things.  First, after adding thousands of documents, the success of Search depends on how well the user defines their search parameters.  Yes, those wizards of search who know how to pick out the special words that make a document unique often still can find the documents they want.  But too often the words most users select are common words shared by hundreds of documents leading to numerous returns that leave the searcher just as bewildered as before.  Second, out-of-box SharePoint only searches the contents of documents less than 16 MB.  Yes, SharePoint still indexes the document name, author and some other metadata for these large documents, but it does not crawl their contents.  Third, by default, the contents of PDFs and some other file types are not crawled at all.  Yes, there are ways to crawl the contents of documents larger than 16 MB as well as to crawl the contents of PDFs, but that is really not the point here because most users don’t even know of these limitations.  So they lose trust in Search and resort to the old tried-and-true method of navigating through the folder maze of libraries hunting down the elusive scent of the documents they seek.

So what should they do differently?  Is there a better way other than doing what they have always done before?  (Have you been wondering how I would get back to my opening comments?)

The first step is banish the evil empire of nested folders since we already know from file share experience that nested folders are not they way to go. Rather explore a new path in SharePoint when storing documents.  That path involves eliminating all or at least most of those folders creating a flatter structure for your library.  Then insert additional metadata columns in your library to classify, organize and filter the files within this simple structure that still lets users find documents easily.

Metadata sounds hard you might say and you don’t know how to use it.  Well, in fact you have already been using metadata all along because every document in a SharePoint library has both a title and a name, an original author and the name of the person to last modify the document, creation dates and last modified dates.  This additional data about your document is metadata.  But you don’t have to stop there.  You can create your own metadata elements such as document categories, project names, tasks, priority, etc. by adding columns to the library definition.  Each new column provides a way to further classify your document.

Here is the cool part.  Since you determine which columns to add to each of your SharePoint libraries, each library can have a different set of columns definitions, different metadata values, specific to the files stored in that library that you can add to and modify over time as your needs change.

Of course once you add new metadata columns, you must go back through each of the existing documents in the library to add appropriate values for that metadata column in each document.

So how does adding metadata improve the organization of your libraries?  Even if you only use a single view of your library, you can filter and sort on any of the metadata columns to select the files that may be of interest.  For example, you may select a project name from a project column and a file type from a type column along with an author’s name from the Created By column to reduce the number of documents displayed in the view from hundreds down to a mere handful.  But why stop there, if you find yourself always filtering by the same metadata values, simply create another view for the library.   Some document wizards even create a set of generic views that perform an initial filtering of the documents and then using the dropdowns available on column header names, further filter and sort the remaining potential documents.  Views can even incorporate group structures that let you expand and collapse a group of documents defined by one or more common elements.

Does that mean that folders have no purpose at all?  No.  They can serve to define custom permissions for different sets of documents.  Although I prefer to use separate libraries to control access permissions, you may still want to keep files related to a project together in a single library and use folders with unique permissions to protect important documents such as financial documents from general access.

Another purpose of folders may be to separate major categories of documents.  For example, a recent project for our Grants department who by the way is trying to eliminate most if not all paper, uses a single level of folders in which each grant has its own folder.  And while a Document Set may be a better approach to their needs, it was decided that the initial paradigm shift to use more metadata with fewer folders was a good start to a better document management in which documents must be shared between departments.

In conclusion, using SharePoint the same way you use a network file share will not result in any improvements in your employee’s productivity.  Reproducing a method from another platform in a new platform typically will not change anything other than cause people to ask why so much money was spent bringing in the new platform.  While doing things differently is no guarantee that you will experience improvements in productivity, I could probably guarantee that doing things the same way as before on a different platform will not make anyone happy in the long run.  So as a New Year’s resolution, you may want to consider the possibility of trying something different and thinking outside of the box.

Finally, this being the time of year let me close with Merry Christmas, Happy Chanukah, Happy Kwanzaa, or Happy Holidays or whatever you celebrate this time of year.

Do You Have A Goal For Your Excel Data?

As it gets closer to the holidays, I’m looking forward to some time off so I’m going to cover some quick Excel analysis tips I’ve run across during the past year during these last few weeks of the year.  When I come back in January, I will be starting a series on Project Crescent in SQL Server 2012.

Solving for a goal in Excel

A common thing that we have been looking at as we prepare for a new budget year is evaluating which of several projects should we take on.  One way to evaluate projects is to calculate the Net Present Value (NPV).  This technique looks at a future stream of expenses and revenues and adjusts them for time to determine what that stream would represent in today’s dollars.  To do this, you have to begin by calculating the expected expenditures and revenues over the next several years as shown in the following table for a simple 5 year project:

A

B

C

D

E

F

1

Project: Widget Upgrade

2 Year 1 Year 2 Year 3 Year 4 Year 5
3 Expenses

$275,000.00

$77,250.00

$79,567.50

$81,954.53

$84,413.16

4 Revenue

$120,000.00

$126,000.00

$132,300.00

$138,915.00

$145,860.75

5 Net

-$155,000.00

$48,750.00

$52,732.50

$56,960.48

$61,447.59

If you just sum each year’s net return, you would be saying that a dollar five years from now is the same as a dollar today.  However, that simply is not true.  Even if inflation were 0%, a future dollar is not worth a current dollar if for no other reason than you can invest a current dollar and have more than a dollar in 5 years (yes, even with the low interest rates banks are currently paying).   In fact, unless you can earn more from your project than the bean counters in finance can earn by investing that dollar somewhere else, your project doesn’t stand a chance.  How much more you must earn is a function of anticipated inflation and risk.  So if you could invest your dollar and earn 5% a year, but expect inflation to be 2% and the project is moderately risky, you may need to earn at least 9 or 10%.

Most projects, such as the one in the above table have fairly high expenses in the first year or two but have moderate operating expenses in subsequent years, at least compared to the expected revenues.  In this example, the first year of the project costs $155,000 more than it brings in.  But in subsequent years, revenue exceeds expenses by about $50,000 or more each year.

Suppose you just added the year net returns together.  You might think that by spending the $275,000 this year, you can cover all expenses and have an additional $64,890.56 in revenue.  That sounds like a good deal right?

The problem is that merely summing the net returns does not take into account the time value of money.  Let’s look at a simple example of the time value of money.  Suppose you could invest the $275,000 and earn 5% per year for each of the next five years?  In year 2 you would have $275,000 * 1.05 or $288,750.  In other words, you would earn $13,750 on your investment.  In year two you would have $288,750 * 1.05 or $303,187.50 earning another $14,437.50.  In fact, over the five years you would earn $59,264.22

So how do we take into account the time value of money in our example?  Well, in the first year, we have expenses of $275,000 but only revenue of $120,000 for a net loss of $155,000.  In the second year, we have expenses of $77,250.00 with revenues of $126,000 for a net gain of $48,750.  Can we simply take that $48,750 and credit it against the first year loss of $155,000?  No, that $48,750 is not worth that much in today’s dollars.  In fact, if you only consider the alternative investment rate of 5%, those second year dollars are only worth $48,750/1.05 or $46,428.57 today.  Why?  Because if you invest $46.428.57 today at 5%, you will have $48,750 a year from today.

Using similar logic, you would discount each of the future year net returns by 5% per year and then sum the results to get $39,016.19.   So you would still make about 39 thousand dollars more by doing this project.  Anything that returns a positive amount is potentially a good project.

NPV

$39,016.19

=B5+C5/B8+D5/B8^2+E5/B8^3+F5/B8^4
%

1.05

But wait a minute, we did not yet account for inflation or risk.  Suppose you said that you really need to discount future year net proceeds by 10% to account not only for alternative investment, but also for inflation and risk.  Performing these calculations and summing the results still yields us a positive $17,663.54.

NPV

$17,663.54

=B5+C5/B8+D5/B8^2+E5/B8^3+F5/B8^4
%

1.1

So at what interest rate would we become indifferent to this project?  By definition, that is the interest rate that make NPV equal to $0.00.  We could continue to guess at different interest rates, but there are some easier ways in Excel.

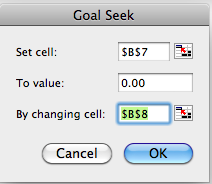
The first way is to use a feature called Goal Seek in Excel.  Goal Seek is great when you are trying to force a specific cell’s calculated value by changing one and only one other cell.  In this case, I set up the equation to calculate NPV in cell B7 and the discount interest rate in B8.  Then I opened the Tools menu in Excel 2011 (for the Mac)  and clicked on Goal Seek.  This opens the dialog shown below:

(Note: if you are using Excel 2010 for the PC, you can find Goal Seek by clicking on the Data –> Data Tools –> What-If Analysis.)

First you have to set the cell that you want to force to a specific value. This is the cell that holds the NPV calculation, B7.  In the second text box, I want to force the set cell to have a value of 0.00.  To do this, I want to change the contents of cell B8.

When you click OK, Excel does the hard work of trying different values in cell B8 until it gets a value of 0.00 in B7.  It does this by performing a series of iterations and projections to quickly narrow down to a correct result.  In this example, it gets a value of 1.148540228.  In other words, this project has a rate of return of just under 15%.  Another way to look at this result is that if the cost of money (opportunity cost, inflation, and risk) were greater than 15%, you would not do this project.

Of course, in this case Excel has another way to calculate this rate, known as the Internal Rate of Return (IRR) for the project by using the IRR() function found in the financial set of functions.

=IRR(B5:F5,1)

The IRR function has two parameters, the first is the range of cells containing the net returns for a project.  The second parameter is an initial guess at the rate of return which I usually start at 1.00 or 0%.  Upon pressing the Enter or Tab key, this function performs the same goal seek analysis to determine the rate of return that results in a value of zero when you sum the values in the referenced set of cells.

Note however that while the IRR() function may be a lot easier to use than setting up a Goal Seek, this function is only good for a specific financial calculation.  On the other hand, Goal Seek can be used for any set of calculations in which the final result must converge to a specific value.

What if your problem has more than one parameter that can vary?  There is another technique within What-If analysis using an add-in tool called Solver which I will cover next time.

Is FAT Documentation For You?

One of the reasons why I think a lot of application users don’t read the documentation is … well let’s be honest … it’s boring.  Typical documentation takes you through menu option after menu option explaining in excruciating detail what each parameter means and when you should use it.  We kid about using the documentation being a great way to break through insomnia and get some sleep, but who are we really kidding.  Most documentation is drier than the Sahara desert in the mid afternoon sun.

So how do you get people to read documentation about a new application rather than just trying to dive into it and ‘experiment’ with the features?  One thing I am trying is a different style of documentation, one that I call FAT documentation.  First, this has nothing to do with your weight or what you ate last night while you were watching the game on TV from the sofa.  Rather FAT stands for Frequently Asked Tasks.

As you might guess, FAT is a variation on FAQ (Frequently Asked Questions) but applied to application documentation.  After all, what is the point of documentation other than to help new users learn how to do different tasks using the tool?  So rather than letting it up to the user to take the initiative to pick up the documentation manual, wade through all of the menu option descriptions and then try to figure out which options apply to the task they are really trying to do, why not make it simple?  Why not help them find just the information they need for just the task they are trying to do?

To create FAT documentation, I begin with application specifications.  In other words, what is the application really supposed to do.  This helps me determine the broad categories of questions that I may want to include in the FAT documentation.  I might begin with questions such as:

  • What is the main purpose of the application?
  • Are their different levels of users in the system and what makes those levels different?
  • How do users enter data?  Are there certain things that must be entered first?
  • If there are look-up tables, how do users maintain them?
  • Can users configure any of the screens to sort or filter what they see?
  • Can users generate reports or download subsets of the data?
  • If a user makes a mistake while entering data, can they go back and fix it?

Based on these types of questions, I define overall categories of questions.  Then I begin going through the application.  During testing I usually ‘discover’ the detailed questions that I want to include.  Why during testing?  Well, good testing includes two styles, white box and black box testing.  It also includes testing with known good data that should produce known good results and testing with known bad data that should produce user-friendly errors or should be caught through validation routines.  In any case, testing is all about asking what the user might do at any point in the application.  This type of questioning is obviously closely related to questioning what should the user be doing at any point in the application, how should they do it, and perhaps even why they should do it.  As a result, these questions can often be rephrased as user tasks, and thus: Frequently Asked Tasks.

Publishing these task related questions now reads more like an action plan rather than dull documentation.  If a user is unsure on how to perform a specific task, they can skim through a table of contents at the start of the documentation divided into groups and identify which questions pertain to the task they are trying to do.  Once they identify one or more tasks that seem to relate to their need, they can just read the corresponding frequently asked tasks to hopefully learn how to perform that task.

Perhaps the next time you need to create documentation for a new application at your organization, you might consider trying FAT documentation to see if that more easily meets the needs of your staff.  Let me know how it goes.

Using the SharePoint Chart Web Part with data from Excel Services – Part 4

First before I begin this week’s discussion on how to use Excel Services with the SharePoint Chart Web Part, I want to tell you that I did get the connection between a SharePoint custom list and an External Data list to filter the data that was passed through to the Chart Web Part.  As expected, the key to making the custom SharePoint list act as a filter to the External Data list was to insure that the connecting field was of the same type.  Therefore, since the year in my SharePoint custom list was stored as a single line of text, I redefined the SQL table to use a CHAR(4) for the Year column.  When defining the External Content Type, I created a filter on the Year column with a default value of 2010, but I set the option to ignore the filter if you passed it a null value.  Then I created the External Data list from the external content type.  Finally I connected the Year column in the SharePoint Custom list to the filter name from the external content type in the External Data list.  I will use a similar technique later in this post.

To start this week’s post, I exported my Open Lab registration and attendance data from SQL Server to an Excel spreadsheet.  You can do this quite easily with the Import and Export Data wizard included with SQL Server.  Be sure to include the field names as column headers.  After completing the transfer, you can open Excel to see a spreadsheet that looks similar to the one on the right.

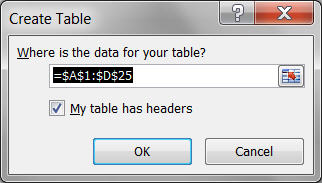
I prefer to then convert the spreadsheet data to a table by selecting the Table option in the Tables group of the Insert ribbon.  Note you can save yourself a few steps if you first select all the rows and columns in the table, including the header row before you begin to insert a table.  This saves you from having to define the table in a subsequent dialog.  Excel still displays the dialog as shown below, but the dimensions of the data table defaults to the selected rectangle.  Be sure to check the checkbox if your table has headers as mine does so that these headers become the column names.

After clicking OK to create the table, define the sort for the table rows.  Since the table should still be selected, simple choose Sort from the Data ribbon to display the dialog shown below.  To sort on more than one column you must define the order in which you are sorting the columns from the top of the list downward.

In this example, I first sort on the Year column.  This column can be a simple sort on the column values from the smallest to the largest.  Remember that you when you sort years save as text, the order is the same as sorting years saved as numbers.

Within each  year, I next want to sort by month.  Again I will select to sort on Values.  However, simply sorting alphabetically does not satisfy the sort requirement as April falls before January.  However, I posted a blog entry a few weeks ago named: “Create Your Own Custom List for Sorting Pivot Rows and Columns” to show how to define custom text lists in which to sort by.  It just so happened that we created a custom list for the month names in a year.  We can reuse that list here to make sure that the months are sorted correctly within each year.  To do this, select Custom List from the Order dropdown.

Then select the custom list you want to use.  If you do not have a custom list yet for the months of the year, now would be a great time to create one.  The following figure shows the selection of the full month names custom list.

We are now ready to publish the Excel spreadsheet to our site, …almost.  First we have to make sure that Excel Services is turned on and is set to trust the site where we will deploy our spreadsheet.  If you do not have rights to Central Administrator, you may need to find your SharePoint administrator and ask him/her for some help to perform the next few steps.

From Central Administrator’s main page, locate the Application Management group and select the option Manage service applications as shown in the figure to the right.

From the page that lists all the service applications, make sure that the Excel Services application has been started as shown to the right of the name.  If not, start it now.

Next click on the title: Excel Services Application.  This allows you to define which sites support Excel services and lets you set various properties for each site.  Note, you must do this by site, not by individual Excel application.

First click on Trusted File Locations.  Central Administrator first shows all the file locations (sites) where Excel Services is currently enabled to support Excel spreadsheets.

If you do not see your site in the current list of trusted file locations, click on the link: Add Trusted File Location to add it.

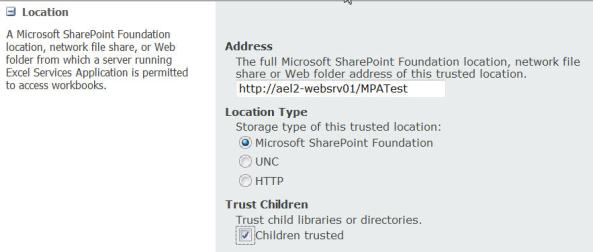
First you must define the site address.  The site address is the root to the site, not to the specific site library or page where you will be storing or using the Excel spreadsheet.  You probably also want to click the option to trust child libraries and directories as shown in the following figure.

There are other options on this page that you can set. While I will not go through all of these options here, you may want to look at a few of the settings such as:

Workbook Calculation Mode Set to Automatic
Allow External Data Trusted data connection libraries and embedded

When you have finished defining the Trusted File Location, return to your Excel spreadsheet and begin publishing it to the trusted site.  From the BackOffice area, select Save & Send to open the available save options.  In the first column click the Save to SharePoint option.  This displays Recent Locations where you may have previously published Excel spreadsheets (if any) and a list of other locations.  Note that the last option in the Locations group lets you browse for a new location.  If you have never published a spreadsheet to the site you want to use, you can either browse to it, or select the Save As button where you can enter the information.

The Save As button displays a standard Windows Save dialog which prompts you for a name and a data type.  If you know the fully qualified name including the site, library and filename, you can enter them all at once in the dialog box and click Save.  However, you can also enter just the name of the site as shown in the following figure.

If you enter the name of the site as the File name, the dialog retrieves from your SharePoint site a list of the libraries available as well as the names of any sites or workspaces embedded within the current site.  You can select the library where you want to store the Excel file by double clicking its name or by single clicking the name and then clicking the Open button.

However, before you click on Open, look at some of the other option available to you when you publish an Excel spreadsheet.  First, you see two checkboxes.  The first tells SharePoint that you want to open this Excel spreadsheet in the browser and not just use SharePoint to save the file.  The second checkbox saves a thumbnail image of the first spreadsheet page that can be used to help identify your spreadsheet from a group of spreadsheets.

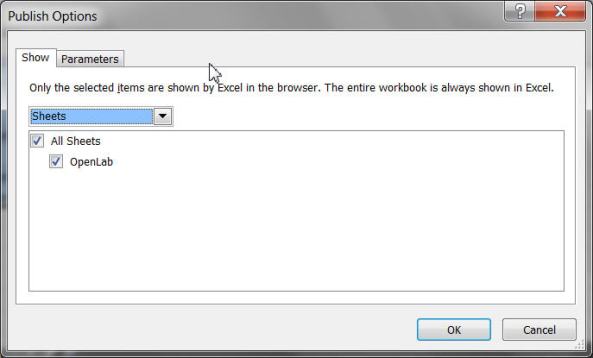
More interesting is the Publish Options button.  When you click this button, you get a dialog with two tabs: Show and Parameters.

The Show tab lets you define what part of the spreadsheet you want to publish.  By default Excel assumes that you want to publish the entire workbook.  You can select the spreadsheets to publish using the Sheets option and the list of available sheets.  You can also use the dropdown to select named ranges to publish.  In this simple example, I will publish all of the worksheets in the workbook.

The second tab lets you define parameters for the spreadsheet.  By default, a spreadsheet published to SharePoint cannot be edited.  However, you can define parameters.  These are nothing more than named cells that serve as the data source for other calculations in the spreadsheet.  For example, you might have a cell that defines the interest rate for a spreadsheet used to calculate the month by month mortgage payments, interest, and principal.  Each times you change the interest rate; you might want to see the effect on the amount of your monthly payment that goes toward interest and principal.  By defining this named cell as a parameter, you can provide interactivity in the spreadsheet for the user.  Note however, that each parameter must reference a single cell.  You cannot define a range of cells with a single parameter reference.  When you are done setting your publishing options, click OK for the dialog and Save to begin the actual publishing process.  (Note, only after you have selected a library will the button say Save instead of Open.)

After you have published your spreadsheet, open a page where you want to use the Chart web part.  If you want, add an Excel Web Access web part from the Business Data categories as shown in the following figure to display the Excel spreadsheet.  However, this step is not necessary if all you want to do is to publish the chart.

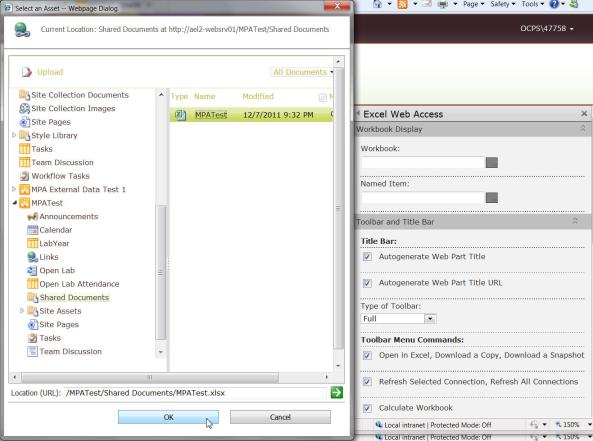
If you do want to display the spreadsheet, open the Excel Web Access’ tool pane and select the Excel Spreadsheet from the library where you published it.  You can enter the full URL of the Excel spreadsheet, but it is more likely that you will click the button to the right of the URL name field to open a dialog that lets you browse to the file.  The figure below shows the Excel Web Part’s tool pane to the right of the image while the browse dialog to find the Excel spreadsheet is on the left.

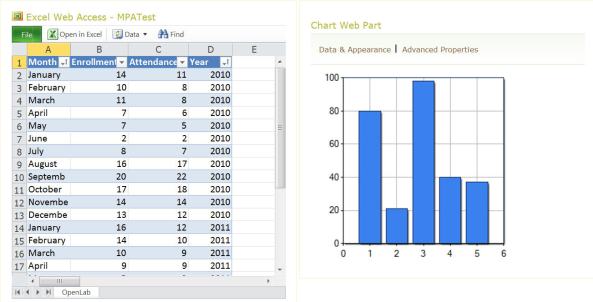
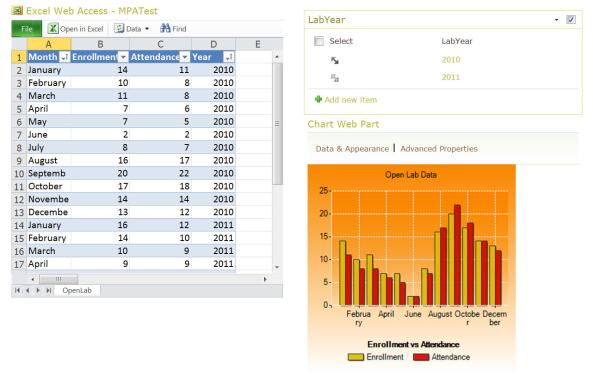
As shown on the left side of the following figure, the Excel Web Access web part displays the spreadsheet exactly as it appears in the Excel spreadsheet itself.  But what we want to show here is the data from the Excel spreadsheet in a Chart web part.  Therefore the Chart web part has been placed to the right of the Excel Web Access web part to make it easy for the user to look at the actual data associated with the chart.

In the last 3 posts in this series on the Chart Web part, we explored the Data & Appearance options that let you define the type of chart, and much of the formatting of the chart and its components.  When you click the Data & Appearance link, you will see the following option choices.

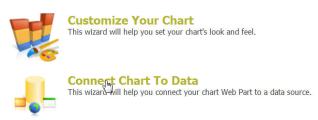
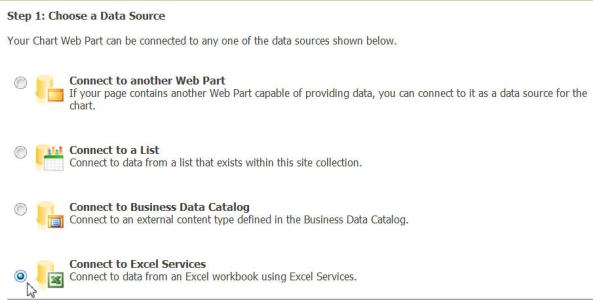
I am going to pick up the process after customizing the chart’s visual aspects by clicking on the link Connect Chart to Data.  In the screen shown in the following figure, choose the data source for the chart.  We previously covered the first three options.  This time, select the fourth option: Connect to Excel Services.

The second step of defining the data source requests information about the Excel Services Connection as shown below.  Unfortunately, none of the three text fields support dropdowns or browse buttons to help fill in these fields.  That makes this screen one of the hardest screens to complete so far.  The first text box however, should already have a default value in it.  Do not change this default value.  It should be correct.
The second text box is the path to the Excel Workbook.  This field is a tricky one to define.  Many users are familiar with the concept of right clicking on a document in a library to get a shortcut to that document.  However, sometimes the link that is provided is not a link to the document directly, but a link to a viewer application that then opens and displays the document.  The following link is an example:

http://ael2-websrv01/MPATest/_layouts/xlviewer.aspx?id=/MPATest/
Shared%20Documents/MPATest.xlsx&Source=http%3A%2F%2Fael2%2Dwebsrv01%2F
MPATest%2FShared%2520Documents%2FForms%2FAllItems%2Easpx&DefaultItemOpen=1
&DefaultItemOpen=1

Such is the case of Excel worksheets published to be opened in the browser.  You want to make sure that the link provided includes only the URL of the site, the library in which the worksheet is stored and the worksheet name ending with .xlsx.  Anything else will cause the connection to fail.  Therefore, in my case, the Excel Workbook Path was:

http://ael2-websrv01/MPATest/Shared%20Documents/MPATest.xlsx

The third text box can either be a range representing the data using the standard column and row format or if you defined a named range for the entire table in the original spreadsheet before publishing it, you can simply enter that name here.  Notice also that if you use the column and row designation, you must include the name of the worksheet, even if you only have one worksheet in the published workbook.  By default this name is Sheet1.  However, if you renamed it in your workbook, you must use the name that appears on the tab at the bottom of the current worksheet.  For example, in my case the worksheet tab name is: OpenLab.

Finally, if your worksheet includes column names in the first row, you must click the checkbox to tell the Chart web part that the range specified includes column names in the first row.  Should you just define your data range without the column name row?  No, because when you set up your chart, you may find it more meaningful to reference your data series by their column names.

In the third step of defining your chart’s data connection, you can define a filter.  Here you can select the column from the Excel Spreadsheet such as Year, which has a type of String, and specify a default value of 2010 as shown in the following figure.  The column that you provide here can be connected with a custom SharePoint list as described at the top of this post to filter the data in the chart.


In step 4, you can define for each series in the chart which columns you want to plot along with the series type and some other parameters that we have seen before in the prior posts and will not be reviewed in detail here.

After defining the data source for the Chart, you can create the connection between a custom SharePoint list such as LabYear shown below by sending the selected row of data to the Chart web part.

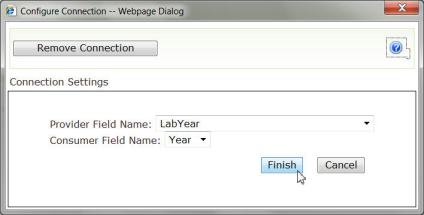
The actual connection must then be established between the provider field in LabYear named LabYear and the Consumer Field Name in the Chart web part named Year (remember the filter parameter we just set). 

When you click Finish, you can control which year of data the Chart web part displays by selecting the year from the LabYear list as shown in the following and final figure of this post.

This concludes my 4-part mini-tour of the Chart Web Part and the different ways to provide data to the chart.  I hope you learned how easy it is to add charts to your SharePoint pages.  As you can see in this last figure, a picture can always make it easier to interpret a set of data.

Too Busy To Think? I’m Thinking That’s Bad.

Do you feel that you are too busy to think at work?  I often do and I’m sure if you had time to think about it you would agree that you were too.  It seems that between meetings with potential clients (yes we tend to think of the other departments within our organization who use our services as clients) meetings with existing clients, team meetings, department meetings, and other staff meetings that some days I’m going from one meeting to another.  With the introduction of laptop computers that you could carry around with you several years ago and more recent mobile devices, there is an expectation that you are available to be interrupted at any time.

Being busy is good in that it makes the day go fast.  On the other hand being constantly on the go can quickly become mentally exhausting.  The human brain wasn’t meant to be constantly on the go like that.  It needs time to ‘digest’ the information that it has received, categorize it and store it.  It also needs time to analyze problems, pull together various facts and make correlations that could lead to a potential solution.  In effect, the human brain is a remarkable computer, a computer that is in a way self-programming.  But just like a physical computer needs time to be programmed, your brain needs time to think about problems, to consider different possible solutions and evaluate these solutions to come up with a recommended plan of action.  If you are constantly keeping it busy doing other things, it really doesn’t have time to do any deep thinking.

Consider: people often come up with some of their best ideas just as they are going to sleep or just as they wake up or perhaps even while they are driving to and from work?  These are times when your brain is either in a more rested state or at least it is thinking about other things.  In any case, it is not focused on a single seemingly unsolvable problem.  I cannot count the number of times over the years of being a programmer that I’ve been stuck on a problem and the more I tried to force myself to focus on just that one problem, the harder it became to come up with a solution.  However if I walked away from the problem for a while, the solution would come to me.  You say that perhaps your boss might get the impression that if you were just sitting back in your chair perhaps even with your eyes closed that you were either day-dreaming or sleeping.  Ok, so what are some things that you can do to increase your thinking time and not appear like you are goofing off?

  1. Take a walk around the building or preferably around the block if you work in a city during lunch.  Sometimes I use ‘walk’ time to listen to music because I work in the city and I do not find the street noises relaxing.  For me that means either Mozart, Bach, or even some of the New Age composers like David Arkenstone.  However, you might even try some of those environmental sounds CDs.  Many times I’ve come back from a lunch walk with a potential solution to a problem that was bothering me all morning.
  2. Change your focus by working on a different task.  Having two or three tasks that you can work between can be a great way to bust through those mental block times when you just cannot seem to figure something out.  As a team lead, I often encourage my staff to work on a different problem for a few hours if they get stuck on one problem.  Then when you come back to the original problem, your brain will feel refreshed and can perhaps look at the problem in a different way and ‘discover’ the solution.
  3. Talk to one of your co-workers about the problem.  This is another ‘trick’ I’ve often found useful and now encourage my staff to do the same thing.  It does not even mean that you necessarily expect the co-worker to solve the problem, although that would be a great benefit as well.  Rather it seems to be something about just putting your thoughts together verbally while telling someone else about the problem that helps your brain reorganize the facts revealing the solution as you are talking. 
  4. Most developers hate to document what they have been working on, but another way to get past a mental block on a problem is to stop working on the problem and start documenting your most recent work creating text that will either become part of the end-user documentation or the system documentation.  This technique combines #2 and #3 above because while you are focused on a different task, documenting, you are talking about the problem using written text rather than verbal words.
  5. Some developers like to listen to music while they code.  I have to admit that I fall into that category.  I had friend back in my FoxPro days that use to say that the best programs were written at 120 dB.  Ok, I’m not recommending that you blast your eardrums out.  However, again I believe that this is just a way to ‘trick’ the brain into opening new creative pathways to problems because you don’t get so focused on a problem to the exclusion of all else that you actually stop thinking about alternatives.
  6. On the other hand, sometimes having just some quiet time to think about what is important in your current task, in your job, in your family, or in your life can stimulate new ideas.  You might come up with a new process that will save time and/or money at work.  You might start making plans where you want your career to be a year from now, five years from now, or even ten years from now.  You might even think about a change in career or a relocation to a city that you always wanted to live in.  For example, I often use quiet time to come up with concepts or program solutions and then use music while I develop out those concepts or solutions.
  7. Getting away from work at night and/or on weekends to do something totally different than what you do at work can reset your brain and improve your creativity.  Find a hobby, sport, or activity that takes your mind off your regular work.  Some of my friends go on hikes, or play sports, or go surfing, or garden, or cook.  It actually doesn’t seem to matter so much what it is as long as you do something different from your normal work hours.
  8. Finally getting away from work for an extended time, one or even two weeks at a time is another great way to recharge your mind and put you in the frame of mind to return and tackle those tough issues again.  I know that those times when I’ve tried to stay in touch with the office when I was supposed to be off on vacation time ending up feeling very unsatisfactory.  It’s like being on call 24/7.  It’s a recipe for burnout. 

In summary, finding time to get away from your normal tasks whether to just think or sometimes to just think about nothing can be very helpful.  Set aside some time each day to just relax and think.  You may be amazed at how much more productive you can become.