Last week I asked the question, ‘How many people must you ask in a survey?’ While I talked about the topic in generalities at that time, I also mentioned that it would be interesting to test the hypothesis that a survey only needs to query a small percentage of the population to get meaningful results.
To test that theory, I took some data from a recent survey that was conducted over several months and disguised the question, but kept the results. The question was a basic Likert Scale type question in which the question itself postulates a specific position and asks the survey take whether they agree or disagree with the statement. This survey was conducted using the SharePoint Survey list and was set to allow a user to only answer the question once so as to not pad the ballot box so to speak.
The total possible population of respondents was around 12,000. Of course the survey owners wanted to get as many respondents as possible which is why they conducted the survey over several months. However, I have always been of the opinion that for this survey, anything more than about a month of making the survey really did not serious effect the overall results. By that I mean that the responses after about a month were a true representation of the total population and that there was no need to try to get 100% participation.
However, the question I chose to use for this study contained five possible responses listed below:
- Strongly Agree
- Agree
- Neither Agree nor Disagree
- Disagree
- Strongly Disagree
Since I was collecting the data with SharePoint, I also stored the date on which each survey was taken. Therefore, I could tell on any given date, how many responses have been entered since the start of the survey. Knowing the total population, I could very easily determine the percent participation. By exporting the data from SharePoint to an Excel spreadsheet, an extremely valuable option from a SharePoint survey, I could load the data into a PowerPivot data model and then create a variety of tables and charts based on the data.
The first figure I show below is the final tabulated results after three and half months of data collection. You can see that the total count of responses was only 8,203 out of a possible 12,000. This represents a little more than 67% of the population. Of the people who responded to the question (Yes, the question was changed to protect the guilty), ‘I believe Pivot Tables help me analyze data at work, 63.7% of them strongly agreed with the statement. In fact, over 96% agreed or strongly agreed with the statement. But my question was, did I need to poll 67% of the population to discover that?

Going back to my PowerPivot table, I added a report filter (For those that don’t have PowerPivot, this data set is small enough that a simple Excel Pivot table would also work fine.).

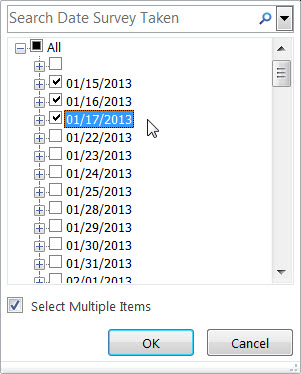
When I opened the filter dropdown as shown in the next figure, I can expand the All node of the value tree to show all the possible values in the table. Note each date is represented as a separate entry.

In order to select multiple dates as my filter, I need to click the checkbox at the bottom of the list box: Select Multiple Items. This action places a checkbox next to each date as well as the All node. By default, all records (dates in my case) are selected.

I first need to unselect the checkbox next to the All node. Then I can select only the dates that I want to appear in my table. For example, in the next figure, I select only the first three days of the survey.
When I click OK, my table updates and shows a total count of 214 survey responses on which 76.64% strongly agreed with the statement. While this is close to the final 63.7% at the end of the survey period, it is still 13% away. Obviously 3 days of a survey are not enough.

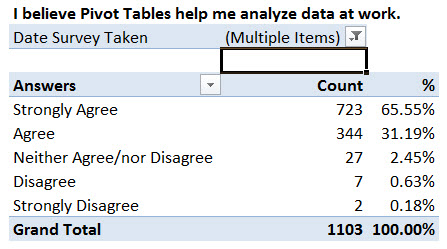
I then chose 10 more days through February 2nd.

This time with 1103 responses, my results for strongly agree was 65.55% and my total for strongly agree and agree were 96.7%. Now I am getting really close to my final results and after only 13 days rather than 3 and a half months.
I added another 10 days bringing my survey count up to 4023, nearly half of the three and half month result and my Strongly Agree percent is starting to settle in at 63.81%, only a tenth of a percent off of the final result.

So, just for fun, (statistics is fun isn’t it?) I decided to chart the percentage of Strongly Agree responses as a function of the survey date. I noticed that by the time I hit a month into the survey, my results had flattened out to around 64% plus or minus less than a half percent.

I then plotted the percent response rate assuming a maximum of 12,000 possible responders and to only about a 15-17% response rate.

So after surveying only about 15% of the population, I could say that the additional survey results over the next two and half months would not significantly affect my results. Therefore, I could also say that it would be reasonable to assume that even though I only surveyed 67% of the total population, getting responses from the remaining 33% would probably not significantly change my results.
That is the power of surveys. The trick is determining when the survey results begin to flatten out. Every survey can be a little different and the number of possible answers to the survey will also affect the result (something we can maybe test in a future blog entry).
If I were plotting this data on a daily basis, I would have been able see when my results began to flatten and be able to ‘declare a winner’ with a great degree of certainty after a month and half or perhaps less. In fact, with greater experience with similar types of data and by using questions with fewer possible answers, the size of the survey can be greatly reduced while retaining a high level of accuracy in the result.
I hope you found this interesting. I chose to give the Tuesday blog a bit more of a technical twist this week because I am about to go on a summer writing schedule. What does that mean? I may drop back to one blog entry a week for most weeks. There is just so many other things to do in the summer that are more fun than writing a blog, like cutting the grass and pulling weeds from the garden or even trimming overgrown bushes. Anyway, I’ll try to keep a few non technical blogs in the mix each month to lighten up the reading from the dry technical topics. When fall comes, I will switch back to two entries a week.
C’ya later.
