Last week I showed you how to build a hierarchy for the Date table that included the fields Calendar Year, Calendar Quarter, and Calendar Month. All three fields were in the Date table so the process was easy. What happens however, when the fields for the hierarchy are in different tables? I cannot create a hierarchy using fields other than those in the same table. The answer is to simply create a calculated field in the table where you want to build the hierarchy based on the fields from the other tables.
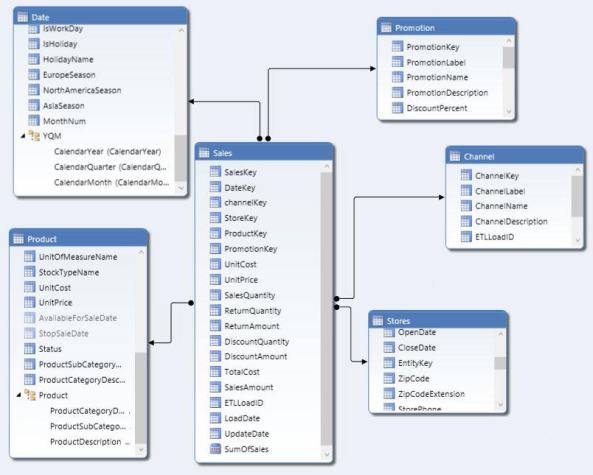
The hierarchy that I want to build today includes the product category description, the product subcategory description and the product description. This hierarchy defines the grouping of products first into subcategories and then into broader categories. Currently these fields reside in three tables as you can see in the following figure.
To add calculated columns in to the Product table that will display the ProductSubcategoryDescription field from the table ProductSubCategory and ProductCategoryDescription from the table ProductCategory, I need to return to the grid view of my model.
Next, I need to select the Product tab to display the fields in the Product table. Using the horizontal scroll bar at the bottom of the grid, move to the right end of the table. You should see one more column named Add Column. Click on this heading to select the column. (Note: if you have a table with a large number of columns, you can also jump directly to the same point as above by clicking on Add Column in the Column drop down menu.)
Right click on the text Add Column and choose the Rename Column option from the menu. I will rename this first calculated column Product Description
After typing in the name and pressing Enter, SSAS takes a few seconds to create the column in the model. When it is done, I can enter the formula for the calculated column. In this case, I simply need to reference the ProductCategoryDescription field from the ProductCategory table. However, because I am referencing a field in another table, I must use the RELATED function so that I get the product category description for the product in each row. I can just start typing and my formula should appear in the formula bar area. However, if for some reason SSAS has lost focus on the new column, you can always click in the first row of the new column and begin typing the formula. My formula in this case is:
= RELATED(ProductCategory[ProductCategoryDescription])
Note that SSAS also allows me to take advantage of the autocomplete feature we saw previously when creating DAX formulas in PowerPivot. I strongly recommend taking advantage of this feature if for no reason other than it eliminates spelling inconsistencies.
After completing the formula and pressing the Enter key, it takes a few moments for SSAS to calculate the values for all the rows in the calculated column.
Similarly, I want to create a calculated column to reference the ProductSubcategoryDescription field from the ProductSubcategory table. The steps are similar so if you are following along, I’ll let you try it on your own.
The right most columns of your product table should look something like the following:
Now you want to switch back to the diagram view mode and create the hierarchy just like we did last week. When you are done, it should look something like the following:
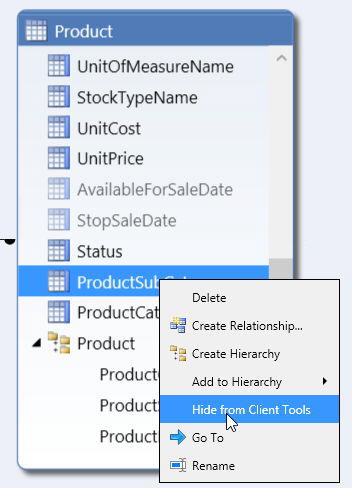
Because we have the hierarchy defined for product category -> product subcategory -> product, we do not need to show the individual fields to the user if we want them to always use the hierarchy. To hide the fields from the PivotTable Fields panel in Excel, right click on the field in the diagram view of SSAS and select Hide from Client Tools.
Repeat this procedure for the three fields:
Product Description
ProductSubCategoryDescription
ProductCategoryDescription
Note: Do the above only where these three items are represented as fields, not where they are defined in the hierarchy. Also, do not delete these fields from the model. If I delete these fields, they cannot participate in the hierarchy. Hide these fields from the client tools only.
You can do the same thing with the two tables:
ProductSubCategory
ProductCategory
Since the only information I need from these two tables now is shown within the Product table, I do not have to display these tables to the end users of the pivot table either. To hide an entire table, right click on the table name in the diagram view and select Hide from Client Tools.
Next, I redisplay the Excel spreadsheet with the pivot table I have been working on and refresh the data by using the Refresh button found in the Analyze ribbon. I see that the PivotTable Fields list displays the product table with my hierarchy first, then a entry: More fields which when expanded shows all the other fields in the Product table. To use the Product hierarchy, I can either select it using the checkbox at the beginning of the field or I can click on the hierarchy name and drag it down to the Rows area (or the Columns area).
As I might expect, I can now expand and collapse portions of the pivot table to see the data that I am most interested.
One last point I want to make for this week. SSAS and PowerPivot can work with both Star and Snowflake schemas. A Star schema is one in which there is a central fact table with one or more dimension tables that radiate out from it sort of like the following figure.
A snowflake schema can have dimension tables that also have additional dimension tables that radiate out from them. My original model is a snowflake schema because the Product dimension has a Product Sub Category dimension that radiates from it and the Product Sub Category dimension has a Product Category dimension that radiates from it. Similarly, the Stores dimension has two additional dimensions that radiate from it, Geography and Entity.
Generally, the closer your model is to a star schema, the better the performance… usually. That statement is not an absolute because while working with a model having fewer tables results in better performance, the remaining tables grow in size with ‘duplicated’ or denormalized data which takes more memory. Therefore, you may need to test both scenarios for your production system to see which is better. However, the point I want to make here is that merely hiding tables from the client tools as I have done with the Product Category and the Product Sub Category tables does not really flatten the model into a star schema. That is because the tables still physical exist and the calculated columns with the descriptions that I created in the Product table are merely pointers to the data in their original tables. That is why you can only hide these tables from the client tools and not delete them. If you truly want to flatten your model to a star schema, you will need to do this in a staging table back within a standard SQL Server database and then bring the resulting tables into the model.
C’ya next time when I look at KPIs in the Tabular model.


Hello would you mind letting me know which hosting company you’re using? I’ve loaded your blog in 3 completely different web browsers
and I must say this blog loads a lot quicker
then most. Can you recommend a good internet hosting provider at a reasonable price?
Thank you, I appreciate it!
WordPress.com
Thanks for ones marvelous posting! I quite enjoyed reading it, you might be a great author.I will be sure to bookmark your blog and will eventually come back in the future. I want to encourage that you continue your great job, have a nice day!|